Brescia University aspires to meet or exceed the FTFT retention rate and cohort graduation rate by maintaining rates that are at or above Brescia’s five-year rolling average based on IPEDS data.
2017 Cohort:
154 Students
Overall graduation rate: 46%
| 4 year graduation rates | 5 year graduation rates | 6 year graduation rates | |
|---|---|---|---|
| Men | 33 | 40 | 40 |
| Women | 37 | 47 | 47 |
| Total (men and women) | 36 | 45 | 45 |
| U.S. Nonresident | 0 | 0 | 0 |
| Hispanic/Latino | 50 | 50 | 50 |
| American Indian or Alaska Native | |||
| Asian | |||
| Black or African American | 33 | 43 | 43 |
| Native Hawaiian or Other Pacific Islander | |||
| White | 33 | 43 | 43 |
| Two or more people | 50 | 50 | 50 |
| Race and ethnicity unknown | 45 | 55 | 55 |
2016 Cohort:
123 Students
Overall graduation rates 43%
| 4 year graduation rate | 5 year graduation rate | 6 year graduation rate | |
|---|---|---|---|
| Men | 29 | 36 | 36 |
| Women | 37 | 51 | 51 |
| Total (men and women) | 33 | 44 | 44 |
| U.S. Nonresident | 0 | 0 | 0 |
| Hispanic/Latino | 0 | 33 | 33 |
| American Indian or Alaska Native | |||
| Asian | |||
| Black or African American | 30 | 40 | 40 |
| Native Hawaiian or Other Pacific Islander | 0 | 0 | 0 |
| White | 35 | 46 | 46 |
| Two or more people | |||
| Race and ethnicity unknown | 50 | 63 | 63 |
2015 Cohort:
148 Students
Overall Graduation Rates 49%
| 4 year graduation rate | 5 year graduation rate | 6 year graduation rate | |
|---|---|---|---|
| Men | 28 | 44 | 46 |
| Women | 38 | 48 | 48 |
| Total (men and women) | 34 | 46 | 47 |
| U.S. Nonresident | 0 | 0 | 0 |
| Hispanic/Latino | 0 | 0 | 0 |
| American Indian or Alaska Native | 0 | 100 | 100 |
| Asian | |||
| Black or African American | 20 | 40 | 40 |
| Native Hawaiian or Other Pacific Islander | |||
| White | 37 | 47 | 48 |
| Two or more people | |||
| Race and ethnicity unknown | 44 | 78 | 78 |
2014 Cohort:
164 students
Overall Graduation Rates: 36%
| 4 year graduation rate | 5 year graduation rate | 6 year graduation rate | |
|---|---|---|---|
| Men | 21 | 27 | 27 |
| Women | 29 | 39 | 39 |
| Total (men and women) | 26 | 34 | 34 |
| U.S. Nonresident | 20 | 20 | 20 |
| Hispanic/Latino | 20 | 40 | 40 |
| American Indian or Alaska Native | 0 | 0 | 0 |
| Asian | |||
| Black or African American | 17 | 33 | 33 |
| Native Hawaiian or Other Pacific Islander | |||
| White | 27 | 34 | 34 |
| Two or more people | |||
| Race and ethnicity unknown | 33 | 50 | 50 |
2013 Cohort:
151 students
Overall Graduation Rate 34%
| 4 year graduation rate | 5 year graduation rate | 6 year graduation rate | |
|---|---|---|---|
| Men | 13 | 18 | 21 |
| Women | 28 | 34 | 37 |
| Total (men and women) | 22 | 27 | 30 |
| U.S. Nonresident | 50 | 50 | 50 |
| Hispanic/Latino | 20 | 20 | 40 |
| American Indian or Alaska Native | 100 | 100 | 100 |
| Asian | 0 | 50 | 50 |
| Black or African American | 11 | 33 | 44 |
| Native Hawaiian or Other Pacific Islander | |||
| White | 19 | 23 | 26 |
| Two or more people | |||
| Race and ethnicity unknown | 39 | 44 | 44 |
Brescia University considers the above five-year rolling average (41.6%) to be an acceptable result for the following reasons:
- The University’s Graduation Rate is improving, with a benchmark in place to improve it further;
- The University enjoys a Block-Transfer Agreement with the Kentucky Community and Technical College System (KCTCS), which leads to a significant number of students transferring in to Brescia University. These students are not reflected on the First-Time Full-Time data above.
- The following chart provides specific numbers of Brescia University students receiving baccalaureate degrees over the past five (5) years showing the transfer student success, beginning with 2019:
| Graduation Year | 2019 | 2020 | 2021 | 2022 | 2023 |
|---|---|---|---|---|---|
| Total Baccalaureate Awards | 200 | 161 | 149 | 192 | 164 |
Brescia University aspires to meet or exceed the FTFT retention rate and cohort graduation rate by maintaining rates that are at or above Brescia’s five-year rolling average based on IPEDS data.
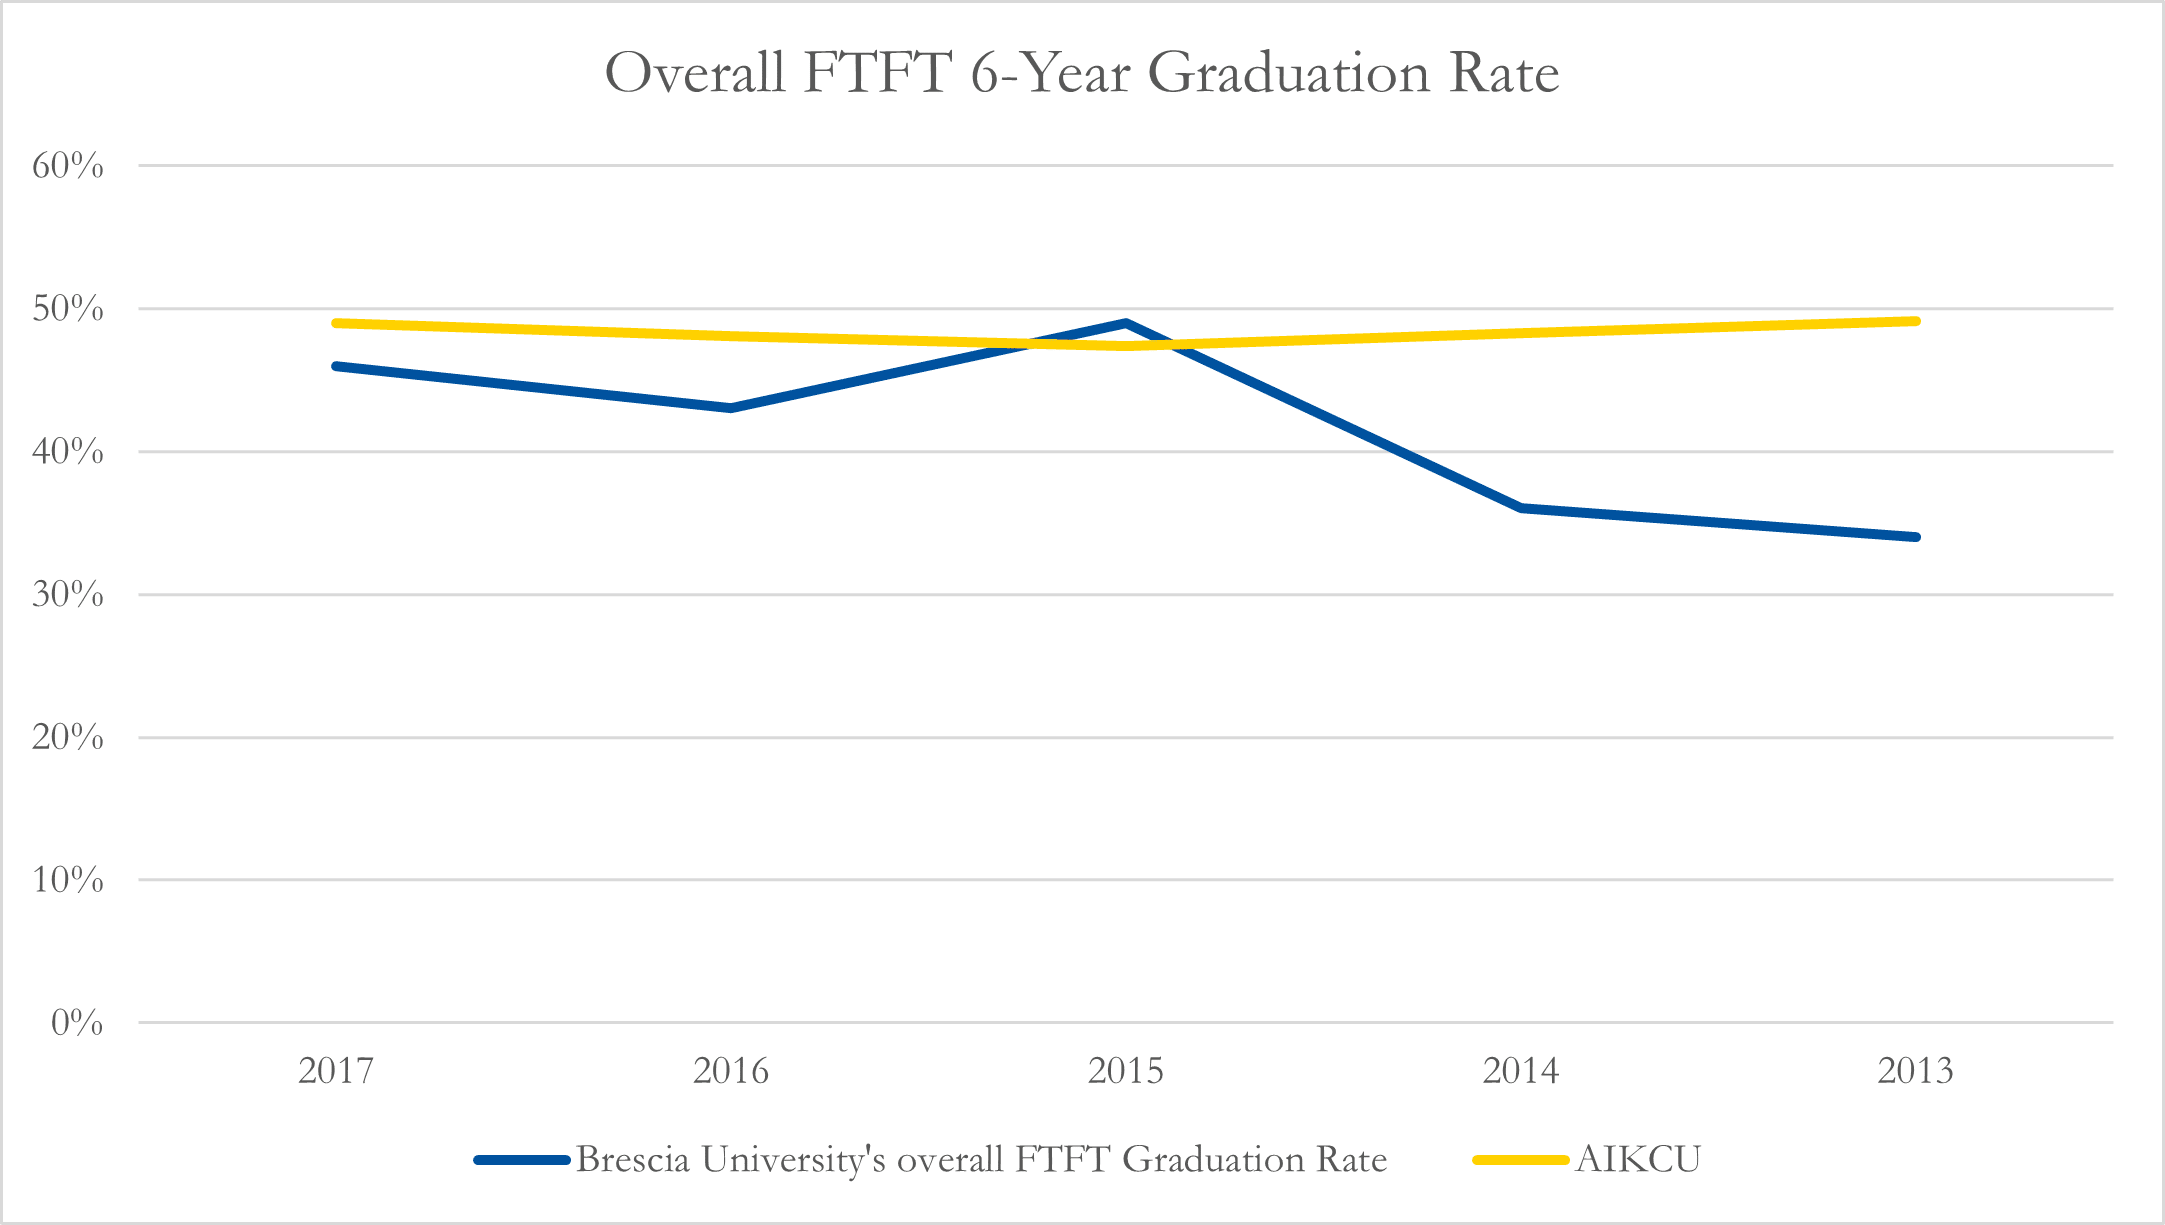
The five-year rolling average based on IPEDS data provides establish a graduation rate baseline. The following graph tracks Brescia University’s overall FTFT graduation rate among peer institutions. For the purpose of comparison, Brescia University uses other members of the Association of Independent Kentucky Colleges and Universities (AIKCU).